


Cruise hit a major milestone recently and announced that they are now giving driverless rides to the public in San Francisco! I’m going to dig into their go to market strategy next week and compare it with Waymo and Tesla.
I am trying something different this week for our regular every-other-Thursday programming. I’m going to share some charts informed by the California DMV’s annual report on autonomous driving testing and disengagements.
Some quick facts from the report:
There were 26 different companies in the report
It has annual miles driven per registered vehicle per company
There are 1174 different vehicles registered for autonomous driving testing in the state, not all of which are active
Testing miles were up nearly 100% from 2020 to 2021 per TechCrunch
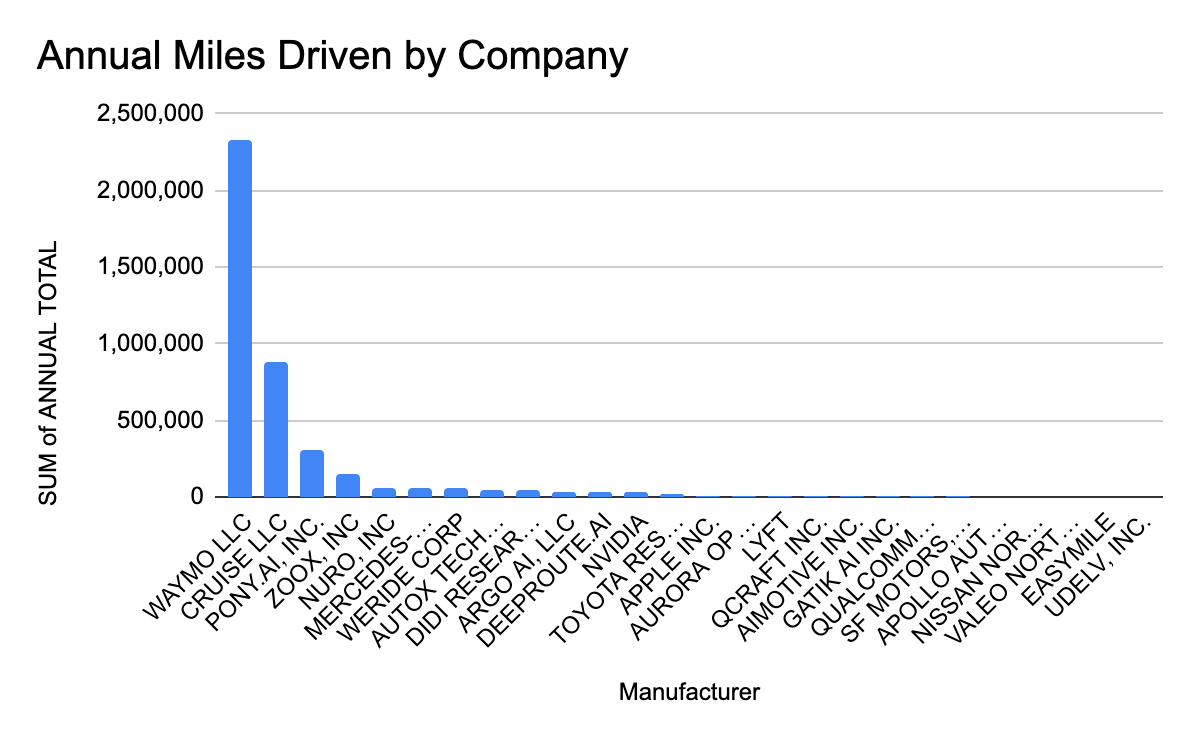
Together, all the cars drove 4.09 million miles
This is a pie chart showing miles driven by company.

Waymo and Cruise clearly dominate with Pony.AI and Zoox a bit further out there. Waymo is nearly at 3x the mileage volume of Cruise. This lead is further shown when you break it out in columns.
But wait, isn’t there a company missing? One that has a fairly charged personality with a strong Musk? Oh yeah, Tesla.
Turns out Tesla isn’t tracked in the DMV’s autonomous testing data. Another way that the name ‘Full Self Driving’ isn’t quite accurate. Let’s re-look at those charts adding Tesla Full Self Driving (FSD) Beta testers in.
Quick note on methodology - How I’m calculating Tesla FSD mileage
In Tesla’s latest earnings report, they shared that they had 60,000 FSD Beta drivers.
In 2021, Tesla had 121,000 vehicle deliveries in California - 12.5% of their total deliveries. (Side note: those CA deliveries are 100X the number of vehicles registered for autonomous testing in CA and they all have Autopilot hardware)
I’m going to use that ratio of % California deliveries for % CA drivers in the FSD Beta.
12.5% * 60,000 = 7500 FSD Beta Vehicles in CA.
The National Bureau of Economic Research did a study to estimate how many miles EV drivers drive in a year and they came up with 5300 miles (14 mi /day). That’s less than a normal combustion vehicle. Makes some sense considering range limitations, charging difficulty, and now the fact that many affluent people are working remotely.
7500 FSD Beta Vehicles driving 5300 miles per year per vehicle. Not all of those miles will be engaged in Full Self Driving Mode. I’m using 10% and 50% for swags.
Revisiting those charts with Tesla
Let’s first look at this with Tesla FSD engaged at 10% to be conservative.


Even at 10% Full Self Driving mode engaged for those beta vehicles, Tesla is the biggest in terms of mileage. They are 70% bigger than Waymo.
While certainly not truly driverless, Tesla needs to factored in because of their scale. Like many of the other companies, Tesla is using a safety driver - in their case it’s the beta enrolled vehicle owner.
If we consider 50% of those beta vehicles’ miles to be in Full Self Driving mode, Tesla is the biggest proportion by far.


While Tesla may dwarf everyone in mileage, it’s important to remember we are still very early in this transition. Californians drive an estimated 340 Billion miles per year.

Including Tesla Beta Drivers at 50% FSD and all the autonomous testing mileage, it’s still just a drop in the bucket. Doesn’t even show up as .1% on a pie chart.
We’ve got a long way to go and I’ll be digging into this more next week. But it’s going to be an exciting journey!
Preet
p.s. I’m chewing on an idea to contain wildfires faster. Use Artillery instead of Planes to drop retardant much faster. It’s very speculative, but I want to do a field test to evaluate efficacy. Review in detail here and then let me know if you have any ideas to consider. Send to friends that you think would be interested in helping out.